What is dimensionality reduction?
Introduced in 2009, single-cell RNA sequencing (scRNA-Seq) allows researchers to observe cellular heterogeneity of the transcriptome at the resolution of individual cells. This method produces vast amounts of data with expression levels of an individual gene for thousands of cells within a single sample.
What is dimension reduction?
ScRNA-Seq data are often compiled in a count matrix, each value in the matrix represents the number of reads in a cell originating from the corresponding gene. The data is high-dimensional, where each individual gene represents a dimension. And as there are so many genes and related information, we cannot (and should not) include all the details. We would then select features (genes and their useful information) to develop models (meaningful subsets of data). What genes are chosen will have a major impact on the performance of downstream analyses.
“The more the merrier” is not the case for scRNA-Seq. With more data than necessary, we need to train the models for longer, use up more computational resources. So instead of that, we use dimension reduction, a computation method that simplifies the data, reducing computational work, eliminating noise and helpings to visualize the highly complex data.
This blog series will give you an introduction to dimension reduction and the three most common methods, PCA, t-SNE, and UMAP. We will describe each method’s strengths and weaknesses, as well as the best practice in handling scRNA-Seq data.
Characteristics of scRNA-Seq data

Single cell workflows typically produce large amounts of data, as they measure whole-genome expression of thousands of single cells within a sample. The computational analysis of such data is difficult due to various reasons:
- (1) Data is high dimensional.
- (2) Data is sparse and noisy – in Figure 1, you can see many zeros and only a few non-zeroes.
- (3) Different cell populations have unequal sizes.
To address some of these characteristics of scRNA-Seq data, we deploy normalization and dimension reduction to transform the original high-dimensional matrix into a lower-dimensional subspace enriched with useful signals. Issue 1 is solved with dimension reduction, whereas issues 2 and 3 are solved with normalization. In this series of blogs, we will first focus solely on dimension reduction. If conducted properly, dimension reduction can reduce levels of noise and complexity, and aid downstream analyses such as clustering and visualization.
How does dimension reduction fit into a scRNA-Seq data analysis workflow?
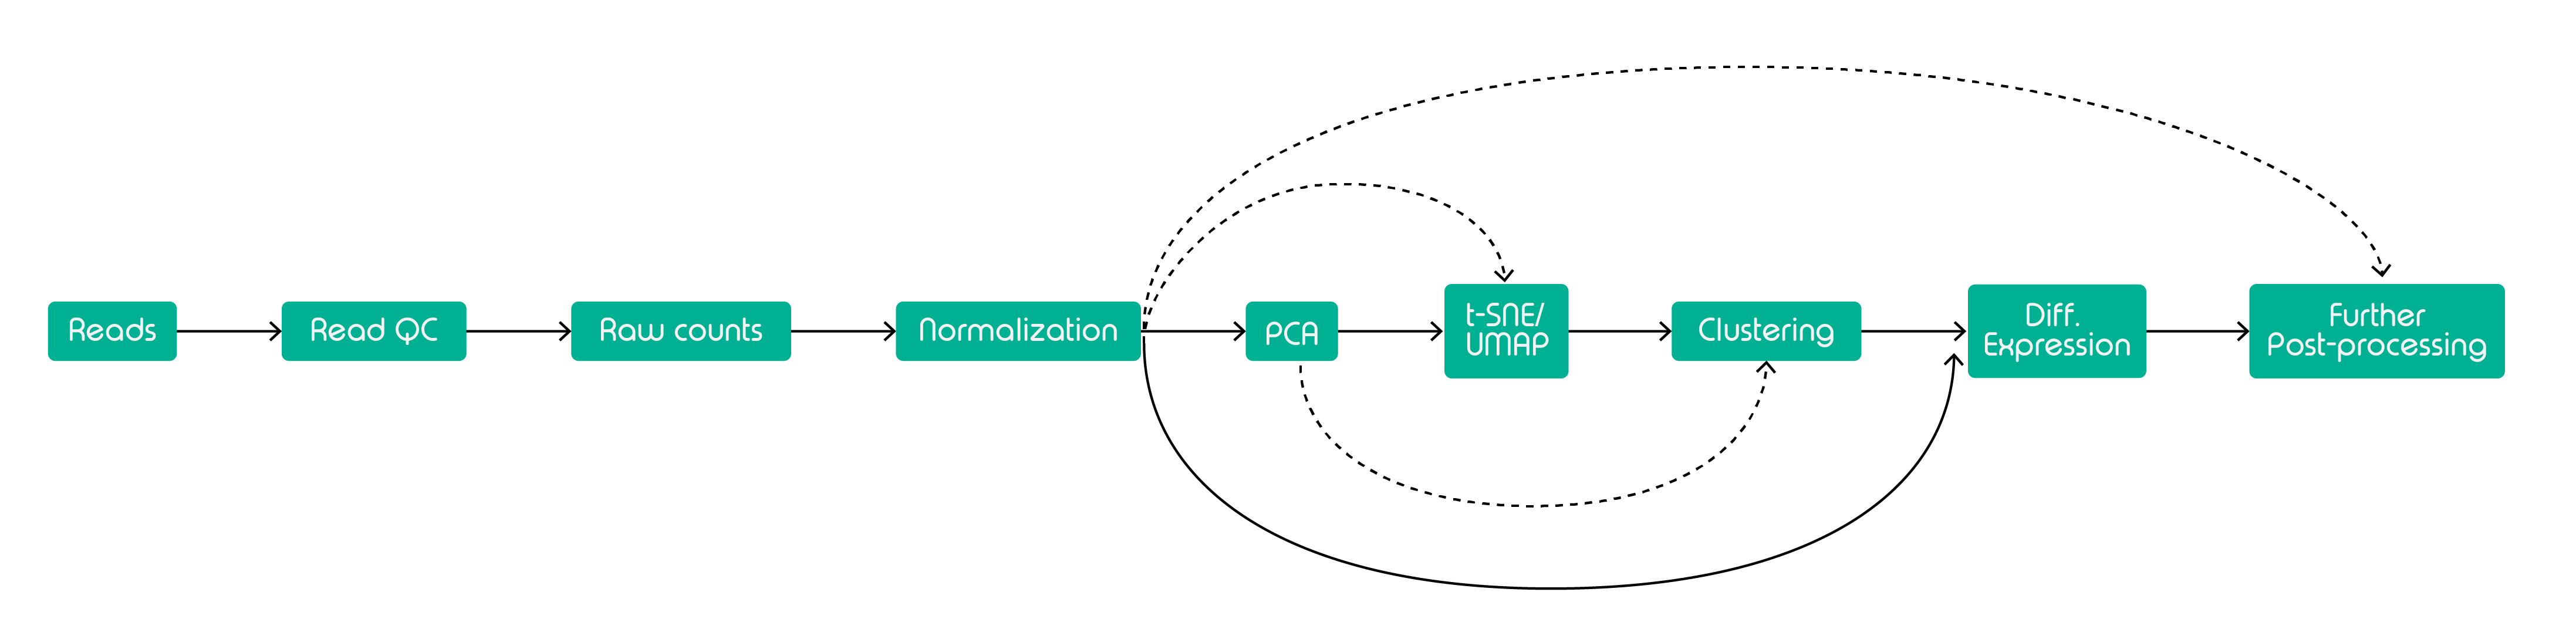
In Figure 2 above, we have a recommended scRNA-Seq workflow, according to the consensus published by the researchers at ELIXIR-EXCELERATE. First, the raw reads (compiled in FASTQ files) must go through multiple rounds of quality control (QC). Common QC metrics include a number of unique molecular identifiers (UMIs), UMI count/cell, genes detected/cell, UMIs vs genes detected, mitochondrial count ratio, novelty score, reads/cell.
After the QC has been completed, we need to normalize the data. Normalization helps remove cell-specific bias by addressing the zeros due to transient expression. After normalization, dimension reduction should be the next logical step. The purpose is to reduce the number of dimensions of the data and optimize the pipeline memory footprint. The three main techniques are PCA, t-SNE, and UMAP. PCA is a full-fledged dimension reduction method that can be used on its own, but recent datasets typically require PCA as the first starting point before using t-SNE or UMAP. After dimensionality reduction, you can conduct downstream analyses, clustering as well as differential expression analyses.
The workflow of choice depends on your research questions, sequencing batches, experimental conditions, sequencing methods, and many other factors. But in general, the above workflow is one of the most commonly used.
Summary
In this first blog in the series on dimensionality reduction, we have introduced you to the most basic concepts of dimensionality reduction in single cell sequencing. You will have learned what a typical scRNA-Seq dataset and a respective post-processing workflow look like. In the next blogs, we will talk in detail about the different popular dimension reduction methods: PCA, t-SNE, and UMAP. Stay tuned!
If you need scRNA-seq-related help, Dolomite Bio offers end-to-end Single-Cell Consultancy Service that helps you through one or more steps of the workflow:
- Sample preparation
- Library preparation
- Sequencing
- Computational Analysis
Interested queries and/or suggestions for what we should write next in our blog series should be directed to: bioinformatics@dolomite-bio.com
Need help with your single cell data analysis? Check out Dolomite Bio’s new Bioinformatics Service