Dimensional reduction methods – PCA
In the previous blog, we introduced dimension reduction in single cell RNA-Sequencing (scRNA-Seq). We have learned that single cell data are sparse, noisy, and high-dimensional and that dimension reduction is needed to turn the data into something more manageable. In this blog, we will discuss the dimension reduction method PCA.
What is PCA?
Principal Component Analysis (PCA) is a method that helps you focus on key variables while ignoring noises and distractions. It compresses the original data and only captures the essence.

Through correlation of dimensions, PCA finds the minimum number of variables (principal components) that keeps the most amount of information. There is a principal component (PC) for each gene. So, if you have 300 genes, you have 300 dimensions and 300 components. To learn how PC specifically apply to single cell research take a look at this article.
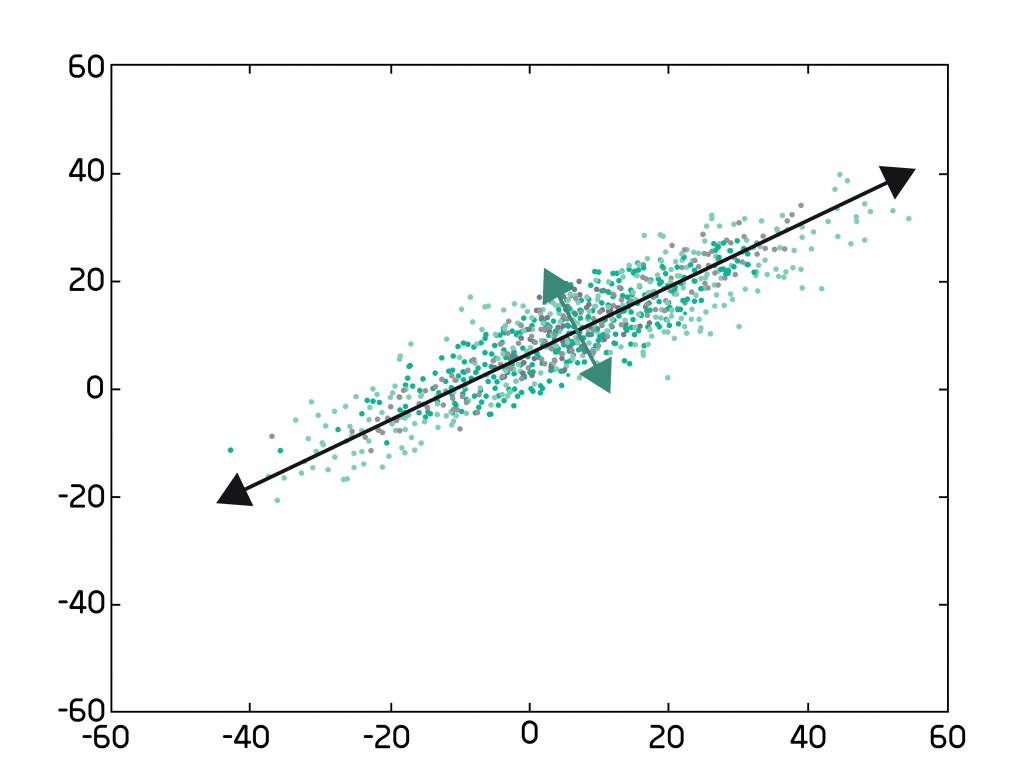
How PCA captures variation between datapoints is nicely visualized by Figure 1 which labels the first 2 PCs with arrows, showing that those 2 PCs display the largest amount of variation. Other PCs of the data would have some component of PC1 or PC2.
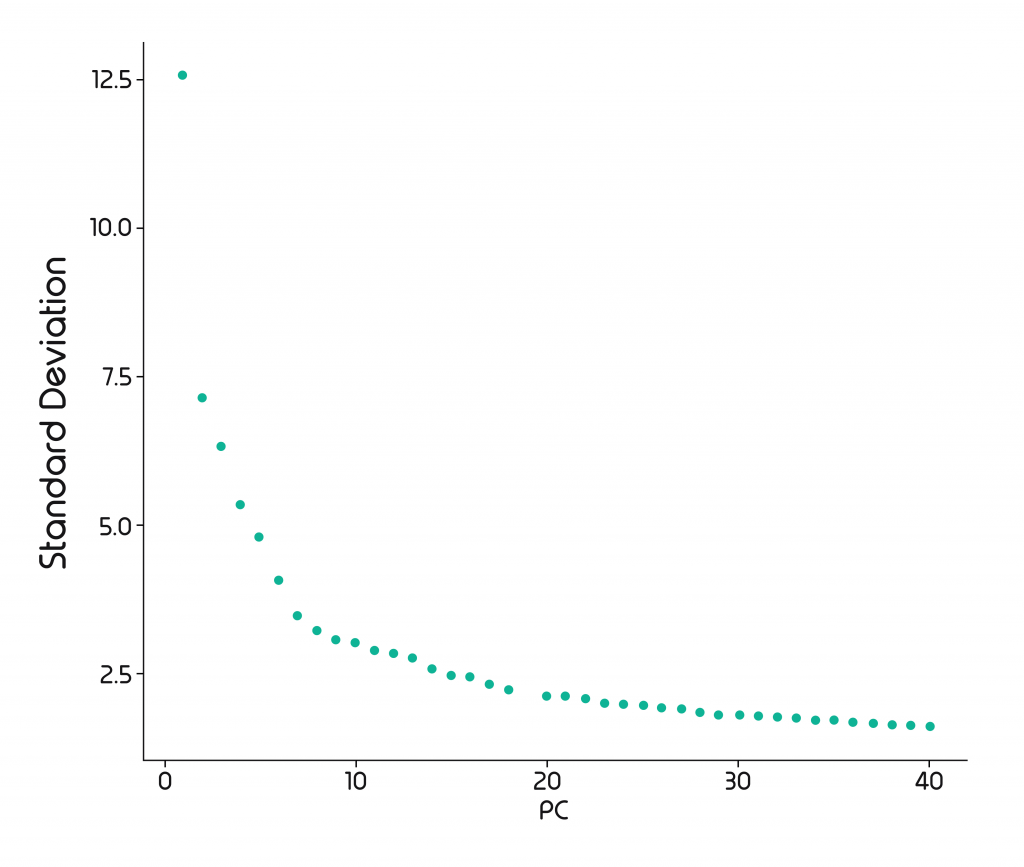
It then orders the PCs by their degree of variability: PC1 spans the most variable dimension, PC2 2nd most, PC3 3rd most, and so on. A Scree plot can show us how well the PCs explain the variation. And we can see that the variation plateaus off after a while. This plateau is where we have our cut-off point.

For a scRNA-Seq dataset, the number of PCs to be kept is typically between 30 and 50, as they usually explain almost all variation. Depending on the size of the datasets you will be required to keep more or fewer PCs. 30 is a good starting point for the analysis and can be adjusted according to the cut-off point in the Scree plot.
The use of PCA is two-fold:
- PCA helps to filter out noise as a basis for downstream analysis and the number of PCs used can be determined through a Scree plot.
- PCA can also be used for visualization. Typically, the first 2 PCs are displayed, which explain the majority of the variance.
PCA Pros
PCA is highly computationally efficient quick and easy.
PCA preserves both, long-range (global) and short-range (local) structures of data.
PCA can be computed iteratively and each of the components is independent from each other. To change the calculations from k dimensions to (k+1) dimensions, you only need to add a few more lines of calculations. This is also useful if you wanted to drop your least useful PC while still retaining most of your variance.
In analyzing actual scRNA-seq data, PCA can give you a quick “sanity check”. For example, to check if replicates are clustering together, or if different conditions produce unexpected effects.
PCA is good as the first method of dimensional reduction. Before using other reduction and clustering techniques, you can use PCA to select the top 10-50 principal components.
PCA Cons
ScRNA-seq data is high-dimensional and highly nonlinear (lots of dropout 0s), while PCA is a linear technique. PCA assumes the original data is linear and normally distributed. These two assumptions are NOT applicable to scRNA-seq data. Under no circumstance should PCA be used as the only visualization technique. It is best used as the first dimensionality reduction method before t-SNE or UMAP is deployed. Before using PCA, data should also be scaled (for instance, with the ScaleData command in Seurat).
The new features (components) created by PCA have no intrinsic meaning. Researchers who do not correctly understand PCA will try to assign real-world implications to the components, leading to incorrect interpretations.
PCA best practices
Looking at the pros and cons of PCA, PCA is best used only as the first dimensionality reduction technique. It is highly computationally efficient, thus will give us some quick sanity check, to assess the next best course of action given a set of scRNA-Seq data.
PCA will also make our work faster and easier if we have further need for t-SNE or UMAP, as it has already made the data more compact and useful.
However, you need to be mindful not to assign any real-world interpretation to the PCs. PCA obscures your features, and wrong interpretation will introduce further problems downstream.
Summary
After the second blog in the series on dimensionality reduction, you will have now learned what Principal Component Analysis is and how it is used for the analysis of scRNA-Seq data. In the next set of blogs, we will continue discussing the other popular methods of dimensionality reduction: t-SNE and UMAP.
The content of these blogs is only meant to be an introduction to the topic of dimension reduction. If you would like to know more about the mathematical basis or the algorithms of PCA, I suggest the following resources:
– Using PCA on Python/Scikit-learn
– Dimension reduction for scRNA-Seq
If you need scRNA-Seq related help, Dolomite Bio offers end-to-end Single-Cell Consultancy Service that helps you through one or more steps of the workflow:
- Sample preparation
- Library preparation
- Sequencing
- Computational Analysis
Interested queries and/or suggestions for what we should write next in our blog series should be directed to: bioinformatics@dolomite-bio.com

